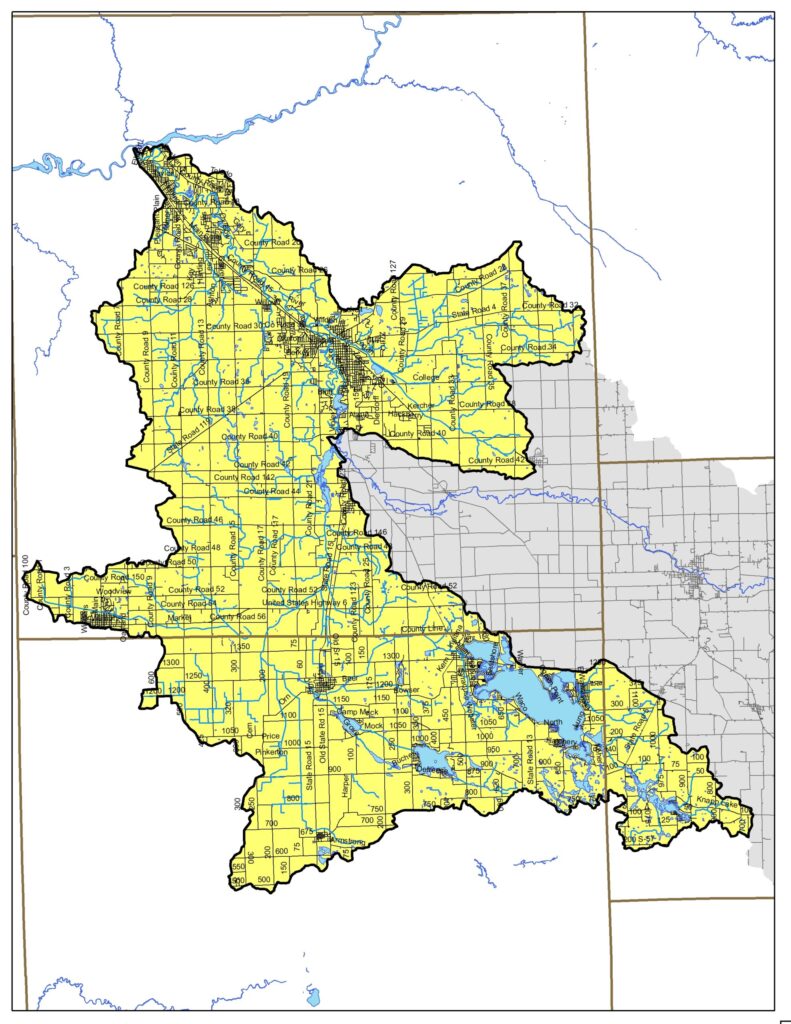
In 2023, the Elkhart River Restoration Association, in partnership with the City of Goshen, launched efforts to protect and improve the Lower Elkhart River Watershed. This effort focuses on updating the Elkhart River Watershed Management Plan for the lower portion of the Elkhart River Watershed. The Lower Elkhart River Watershed drains 295 square miles including portions of Kosciusko, Noble, and Elkhart Counties.
What is a Watershed?
The Lower Elkhart River Watershed Project focuses on protecting and improving water quality in the Lower Elkhart River Watershed. A watershed is formed by all of the land from which water drains into a singular waterbody. These drainage boundaries are determined by land elevation rather than state or county lines, political boundaries, or residential property lines. View the Elkhart River Watershed Map..
About the Lower Elkhart River Watershed
The Lower Elkhart River Watershed drains portions of Kosciusko, Noble, and Elkhart Counties (295 square miles) and includes two sub-watershed areas: Solomon Creek-Elkhart River and Turkey Creek. More than 389 miles of streams are present in the Watershed. Water quality impairments include: 139.6 miles of E. coli, 46.9 miles for biotic communities, 7.8 miles for dissolved oxygen (DO), 7.8 miles for nutrients (e.g., nitrogen and phosphorus), and 9 miles for PCBs in fish tissue. Additionally, lake impairments include phosphorus (3), biotic communities (4) and PCBs in fish tissue (1). Based on 2016 land cover data (NLCD), nearly 58% of the Watershed is in agricultural row crops (corn-soybean) with 9% in pasture, 12% in forested or wetland land uses, 17% urban, and 3% open water.
Based on data compiled as part of the 2008 Watershed Management Plan, nutrients, sediment, and E. coli are the primary nonpoint source concerns in the Elkhart Watershed. Using models, the plan identified loading rates of 1.5 million tons of Phosphorus per year, 1.8 million tons of Nitrogen per year, 2.4 million tons of total suspended solids (TSS) or sediment per year, and 6.2E+13 colonies of E.coli per year in the Lower Watershed.
Historic water quality data collected from 2002 to 2019 by the Indiana Department of Environmental Management (IDEM), the United States Geological Survey (USGS), Elkhart County Health Department, Hoosier Riverwatch volunteers, and consultants (LARE, 319 projects) indicate that 81% of Nitrogen, 77% of Total Phosphorus, 69% of TSS, 81% of turbidity, 11% of pH, 12% of DO, and 82% of E.coli samples exceed water quality targets or state standards. The Elkhart County Health Department notes that the Elkhart River routinely contains E. coli concentrations above the state standard and that tributary concentrations measure higher than the mainstem of the River. Sources of elevated nutrients, excess sediment, and pathogen concentrations in excess of state standards originate from agricultural and urban sources as follows:
- 31% of the Watershed is covered by highly erodible soils. These are easily erodible under wind and water and carry sediment and nutrients to adjacent streams or waterbodies.
- 23% of the Watershed is covered by hydric soils; however, only 7% of the Watershed is under wetland land uses. The ditching and draining of wetland areas converted the land into agricultural and commercial development which increases sediment and nutrient runoff, reduces water retention, and alters the overall Watershed’s hydrology leading to flooding issues downstream.
- Based on 2019 transect data, approximately 33% of the Watershed is conventionally tilled, while cover crops are used on less than 25% of agricultural land. This results in more than 46,000 tons of sediment and sediment attached nutrients (e.g., nitrogen and phosphorus) carried into Lower Elkhart River Watershed ditches, streams, and river annually.
- 95% of the Lower Elkhart River Watershed soils are very limited for septic use. Septic system failures are relatively common near Goshen and around many of the Watershed’s lakes where property size is too small to treat septic drainage.
- Ten wastewater treatment plants and five (5) regional sewer districts handle wastewater effluent for urban developments in the Lower Elkhart River Watershed.
- IDEM permit data indicate 28 CFOs or confined feeding operations and 10 CAFOs or concentrated animal feeding operations are present in the Lower Elkhart River Watershed. These house more than 775,795 hogs, cows, chickens, ducks, and horses which produce more than 303,949 tons of manure annually. This manure produces more than 19,954,614 tons per year of Nitrogen, more than 16,189,621 tons per year of Phosphorus and more than 1.36x10E20 colonies per year of E. coli. Calculations are based on data from Texas A&M, 2009 and Georgia DNR, 2014.
- Portions of three Municipal Separate Storm Sewer System (MS4s) communities are located in the Lower Elkhart River Watershed: Elkhart County, City of Goshen, and City of Elkhart. Collectively, the MS4s drain more than 27 square miles of urban hardscape with more than 115 miles of stormwater pipe. Stormwater runoff typically carries sediment, nutrients, trash, and other materials into the storm system and then into the Elkhart River and its tributaries untreated, which can lead to sediment and nutrient loading to the River.
Goals for the Lower Elkhart River Project
- Watershed Management Plan: The Lower Elkhart River Project will connect stakeholder concerns with water quality and computer-generated data to develop a step-wise plan to protect and improve the Lower Elkhart River Watershed, its landscape, and its water quality. The planning process will include regularly-schedule steering committee meetings with watershed plan drafts posted for review.
- Watershed Inventory: Complete a watershed inventory through desktop and windshield surveys. This will be done by gathering historic water quality and watershed data and reports, talking with watershed stakeholders to gather input and opinions and learn more about how stakeholders interact with the watershed will be the focus. Desktop inventory will include historic data and report review, water quality benchmark determination, mapping of previous and current hot spots and GIS mapping. A windshield survey, physically driving along the roads of the watershed to look at land use types adjacent to waterways and waterbodies, will also be completed.
- Water Quality Monitoring: Water quality monitoring will be conducted at 18 locations in the Lower Elkhart River Basin once per month for one year starting in February 2023. Samples will be collected for a variety of nutrient and sediment parameters and combined with historic water quality data. This compilation will provide a foundation for identifying water quality issues and probable sources of pollutants. The baseline will also provide a foundation for measuring future changes in water quality.
- Samples will be analyzed for nitrate, TP, TSS and E. coli. Field measurements of flow, temperature, conductivity, DO, pH and turbidity will also occur. Biological monitoring will occur during year 1 at all 18 sites.
- Engagement and Outreach: The Lower Elkhart Project will engage youth and adults through Hoosier Riverwatch monitoring; annual project meetings; agricultural and urban-focused workshops/events; quarterly newsletters; local tours; social media; and more.
Read the Latest Watershed Management Plan Draft Here.