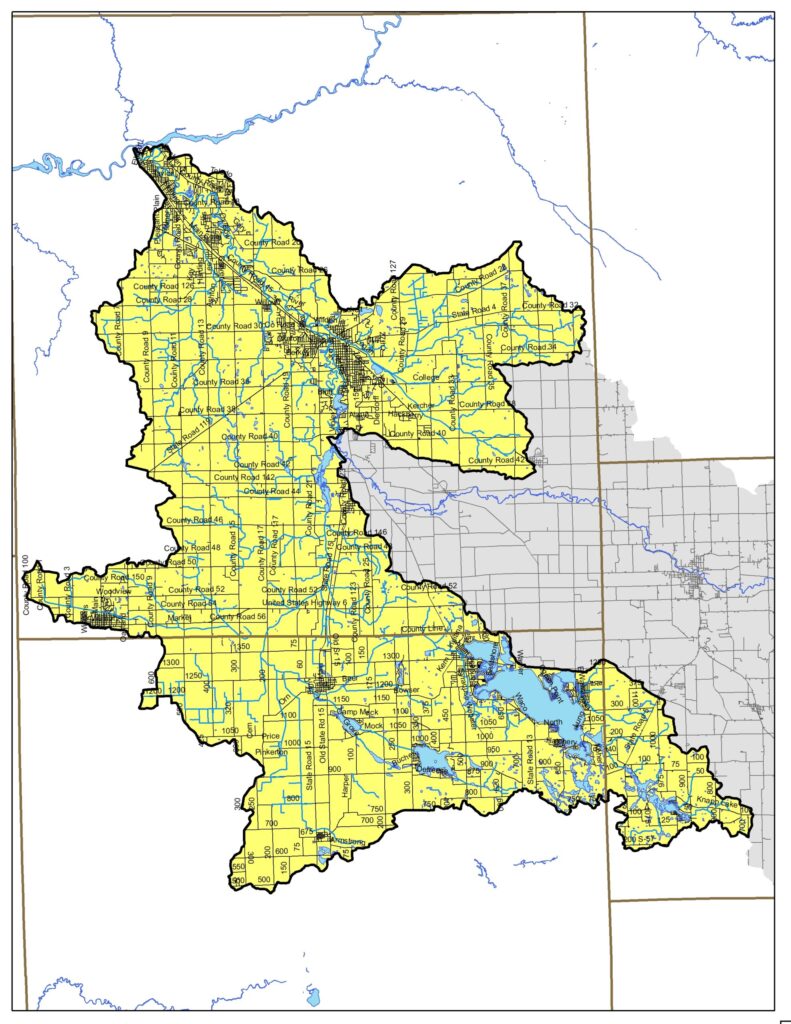
In 2023, the Elkhart River Restoration Association, in partnership with the City of Goshen, launched efforts to protect and improve the Lower Elkhart River Watershed. This effort focuses on updating the Elkhart River Watershed Management Plan for the lower portion of the Elkhart River Watershed. The Lower Elkhart River Watershed drains 295 square miles including portions of Kosciusko, Noble, and Elkhart Counties. Read the Approved WMP.
What is a Watershed?
The Lower Elkhart River Watershed Project focuses on protecting and improving water quality in the Lower Elkhart River Watershed. A watershed is formed by all of the land from which water drains into a singular waterbody. These drainage boundaries are determined by land elevation rather than state or county lines, political boundaries, or residential property lines. View the Elkhart River Watershed Map..
About the Lower Elkhart River Watershed
The Lower Elkhart River Watershed drains portions of Kosciusko, Noble, and Elkhart Counties (295 square miles) and includes two sub-watershed areas: Solomon Creek-Elkhart River and Turkey Creek. More than 389 miles of streams are present in the Watershed. Water quality impairments include: 139.6 miles of E. coli, 46.9 miles for biotic communities, 7.8 miles for dissolved oxygen (DO), 7.8 miles for nutrients (e.g., nitrogen and phosphorus), and 9 miles for PCBs in fish tissue. Additionally, lake impairments include phosphorus (3), biotic communities (4) and PCBs in fish tissue (1). Based on 2016 land cover data (NLCD), nearly 58% of the Watershed is in agricultural row crops (corn-soybean) with 9% in pasture, 12% in forested or wetland land uses, 17% urban, and 3% open water.
Based on data compiled as part of the 2008 Watershed Management Plan, nutrients, sediment, and E. coli are the primary nonpoint source concerns in the Elkhart Watershed. Using models, the plan identified loading rates of 1.5 million tons of Phosphorus per year, 1.8 million tons of Nitrogen per year, 2.4 million tons of total suspended solids (TSS) or sediment per year, and 6.2E+13 colonies of E.coli per year in the Lower Watershed.
Historic water quality data collected from 2002 to 2019 by the Indiana Department of Environmental Management (IDEM), the United States Geological Survey (USGS), Elkhart County Health Department, Hoosier Riverwatch volunteers, and consultants (LARE, 319 projects) indicate that 81% of Nitrogen, 77% of Total Phosphorus, 69% of TSS, 81% of turbidity, 11% of pH, 12% of DO, and 82% of E.coli samples exceed water quality targets or state standards. The Elkhart County Health Department notes that the Elkhart River routinely contains E. coli concentrations above the state standard and that tributary concentrations measure higher than the mainstem of the River. Sources of elevated nutrients, excess sediment, and pathogen concentrations in excess of state standards originate from agricultural and urban sources as follows:
Goals for the Lower Elkhart River Project
